|
|


SOHFEA Software Package, Documentation and Data by Daniel F. McGinnis is licensed under a Creative Commons Attribution-NonCommercial 4.0 International License.
SOHFEA Sample Data Set: Baltic Sea
SOHFEA: Sample Data
Baltic Sea
Data Overview
64 Hz data
0.2 - 6 hours
Data collected with Nortek Vector which uses two analog input channels.
Channel 1: FP07 Fast Temperature
Channel 2: Clark Fast O2 Sensor
Baltic Sea
Data Overview
64 Hz data
0.2 - 6 hours
Data collected with Nortek Vector which uses two analog input channels.
Channel 1: FP07 Fast Temperature
Channel 2: Clark Fast O2 Sensor
GEOMAR EC Device aboard RV ALKOR with UNISENSE frame (McGinnis et
al. 2011)
Contact:
Daniel F. McGinnis
dfmcginnis@yahoo.com
Updated January 30, 2014
Daniel F. McGinnis
dfmcginnis@yahoo.com
Updated January 30, 2014
Vector Output Files:
BalticSea.hdr (9kb)- Header file containing input parameters and output descriptions
BalticSea.sen (2mb) - Direction information, temperature etc.
BalticSea.dat (24mb zipped) - Data file
SOHFEA Results - Output Files:
ConfigSOHFEA.dat - Configuration file I used for the data
Baltic.zip (10mb)- Intermediate output files (from Steps 1 - 3)
Out300_30sT.Dat - My Output Temperature (Channel 1)
Out300_30sO2.Dat - My Output Oxygen (Channel 2)
SOHFEA - Running the model:
1. Download the Vector Output files above.
2. Download the 4 *.exe programs (and ConfigSOHFEA.dat) + SophieHEAT (not included in zipped program package.
3. Place all program files in the same directory as the data files on your computer.
4. Set up ConfigSOHFEA.dat file - either download the example above, or configure yourself. The calibration equations are:
Channel 1 Tc = 0.000351568 x VectorCounts + 0.11487
Channel 2 DO = 0.01205 x VectorCounts + (-36.23807)
5. Execute the programs sequentially (or use the RUN.BAT file).
Generally, the data are of good quality. I averaged it down from 64Hz to 8Hz. For SOHFEA, I used an eddy window of 5 minutes (300 seconds) and a running mean of 30 seconds. I briefly summarize the results below.
Note: All results below are viewed and plotted in Origin. The user is responsible for obtaining their own postprocessing (e.g. Matlab)
Results
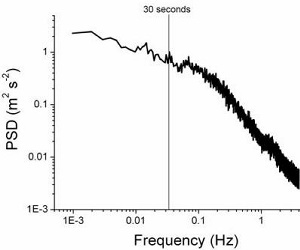
Right - power spectrum performed on the filtered data (8 Hz). The spectrum was performed in Matlab on the global vertical velocity data set. Thirty seconds is taken as the eddy time scale for the running-mean (see Lorrai et al. 2010 or McGinnis et al. 2008 for more info).
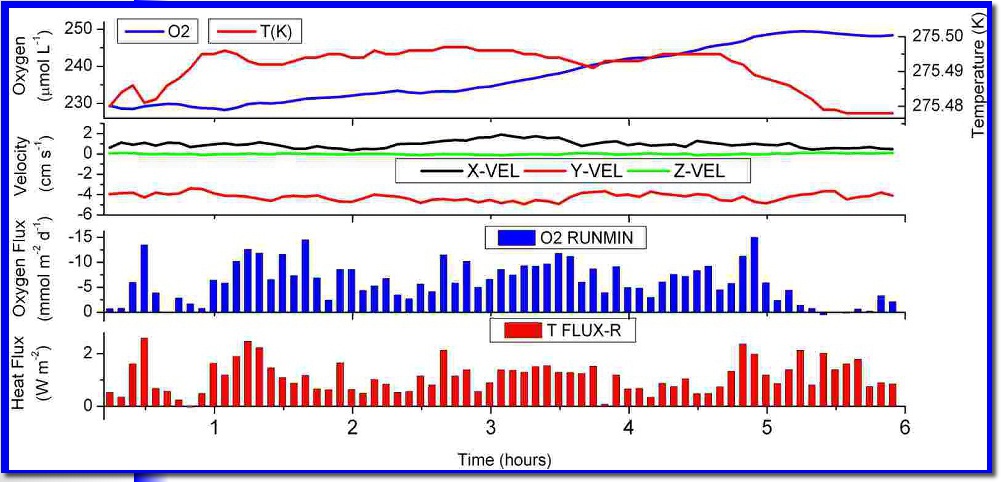
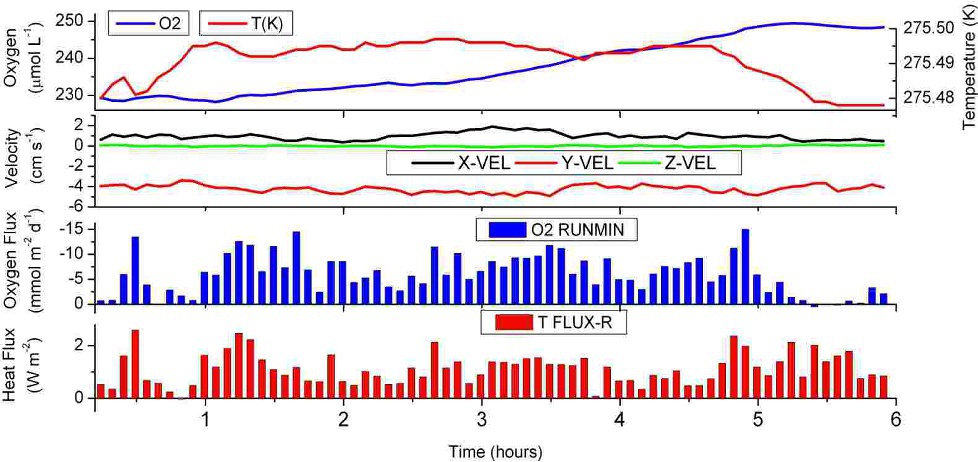
The fluxes are shown below for the heat and the O2. The heat fluxes are the running mean with no shifting (the T sensor response time is ~7 ms). The O2 fluxes are with a time shift seeking the minimum flux values to account for the response time of the sensor (~0.3 s). The values shown are the 5 minute averages for T and DO (top panel) and x, y and z velocity (2nd panel).
Right - power spectrum performed on the filtered data (8 Hz). The spectrum was performed in Matlab on the global vertical velocity data set. Thirty seconds is taken as the eddy time scale for the running-mean (see Lorrai et al. 2010 or McGinnis et al. 2008 for more info).
The fluxes are shown below for the heat and the O2. The heat fluxes are the running mean with no shifting (the T sensor response time is ~7 ms). The O2 fluxes are with a time shift seeking the minimum flux values to account for the response time of the sensor (~0.3 s). The values shown are the 5 minute averages for T and DO (top panel) and x, y and z velocity (2nd panel).
coming soon